GASWorkS
Network Modeling Tools to Analyse Design and Distribution Natural Gas
GASWorkS has continued to evolve since our first quite simple but effective version of the software was released in 1991. Our latest release supports a very sophisticated map style graphical data interface, a quick solution routine, and provides support for a number of different model elements, including support for individual customer features. GASWorkS provides an extensive set of network modeling tools designed to assist the User analyze and design distribution, transmission, gathering, and plant piping systems conveying natural gas or other compressible fluids.
GASWorkS may be used to create steady-state models of systems containing not only standard pipe type elements, but also supports regulator, compressor, valve, well, and fitting type elements.
GASWorkS calculates the estimated valve coefficient for regulators, and the estimated power and fuel requirements for compressors. A pipe sizing function is provided to assist in determining the required size for selected pipes in the model.
The Solution Method...
GASWorkS uses a Newton-Nodal, iterative method of solution. It supports a number of flow equations including the AGATurbulent, Colebrook, IGT-Improved, Mueller High and Low-Pressure, Oliphant, Panhandle-A, Panhandle-B, Pole Low- Pressure, Spitzglass High and Low-Pressure, and Weymouth equations. The solution routine provides efficient solution of virtually any sized model – tested to 250,000 node.
The solution routine allows the flowing temperature to be calculated based on environmental heat loss and gain. Gas properties at a specific location , including specific gravity, viscosity, ratio of specific heats, and heating value, can be calculated based on the gas composition. Mixed gas properties throughout the system can be calculated based on the flow distribution. Compressibility can be calculated using one of several methods, including the latest revision of AGA 8.
Graphical Data Interface (GDI)
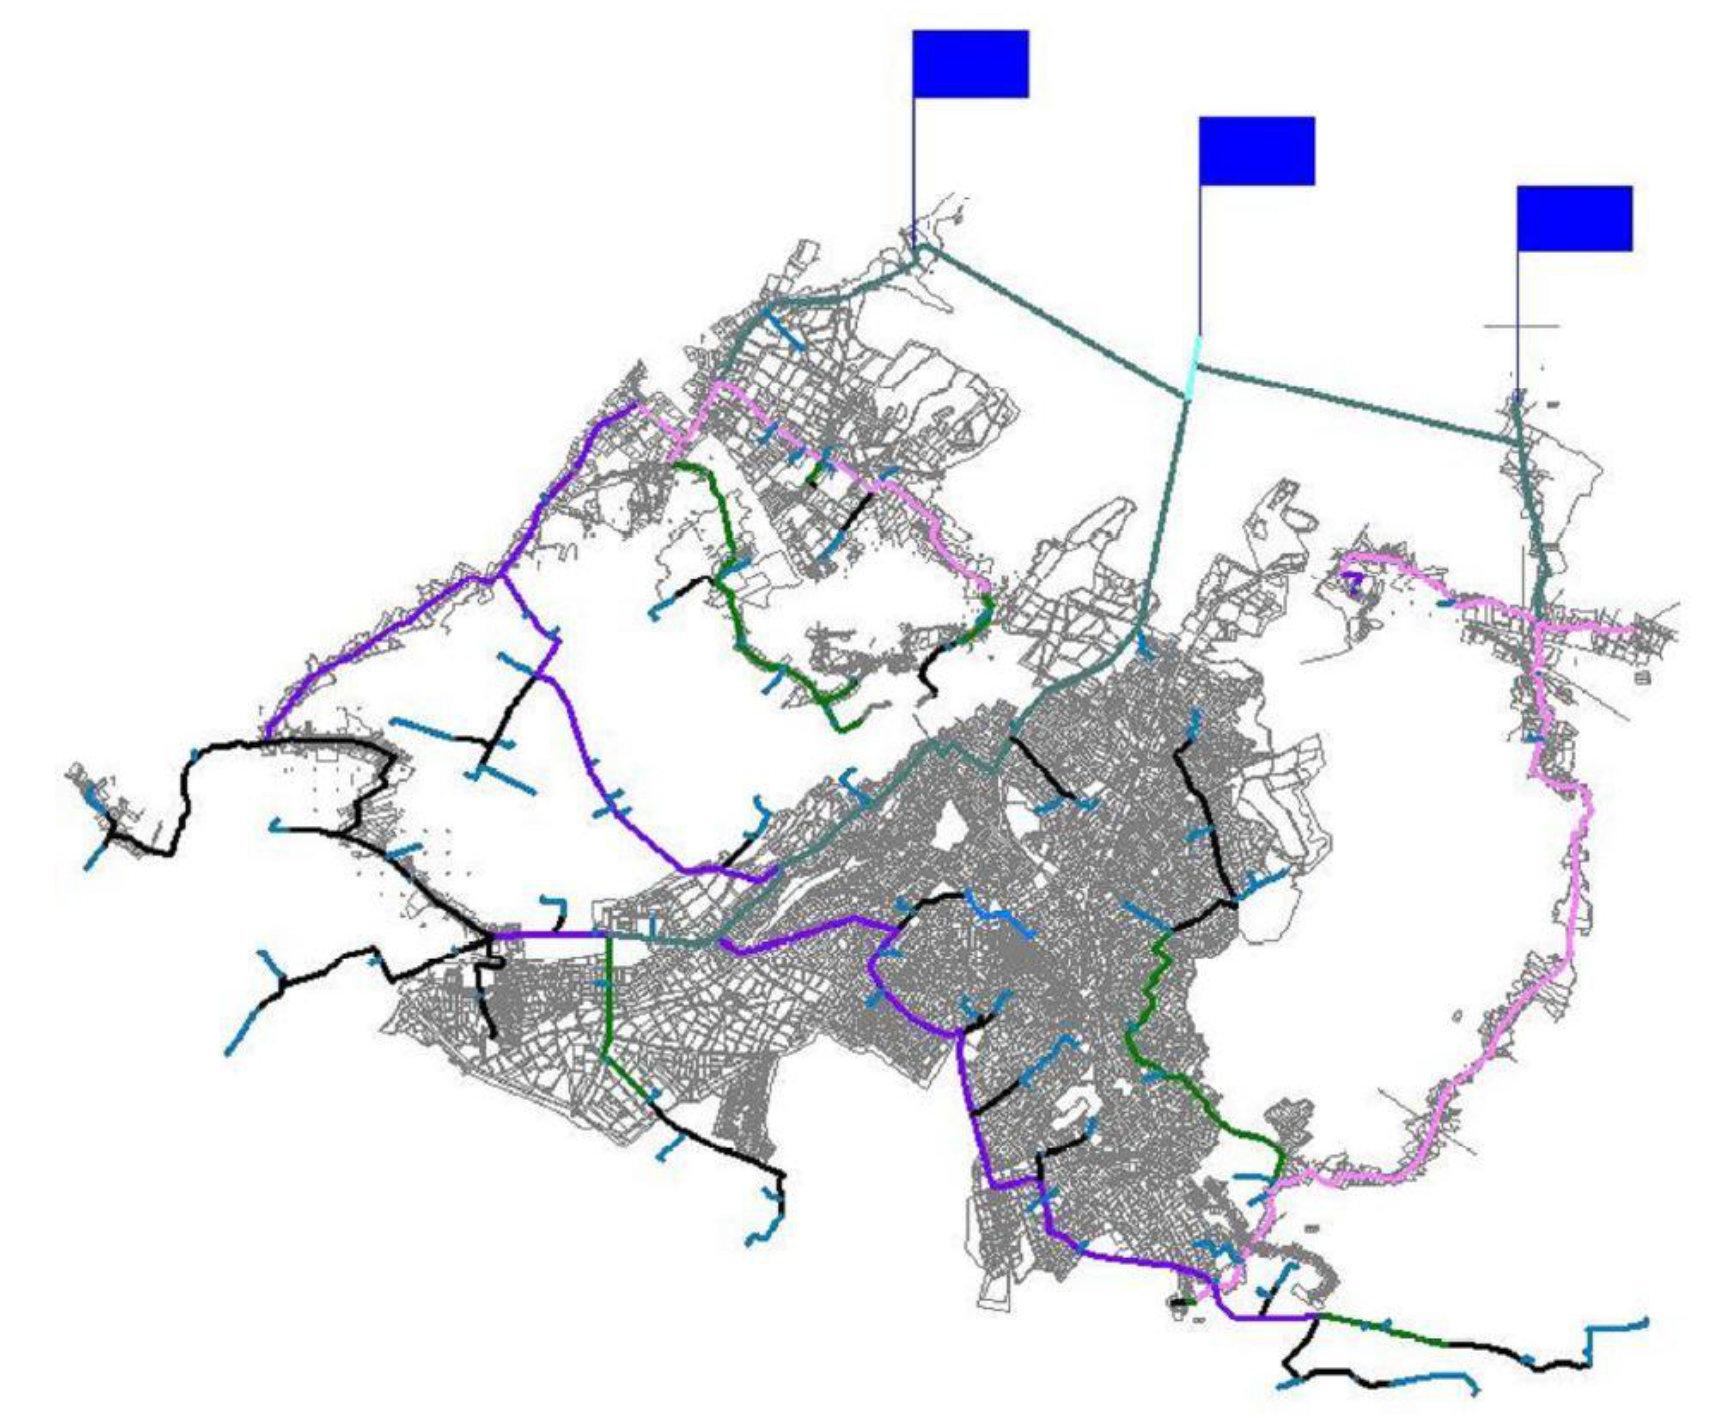
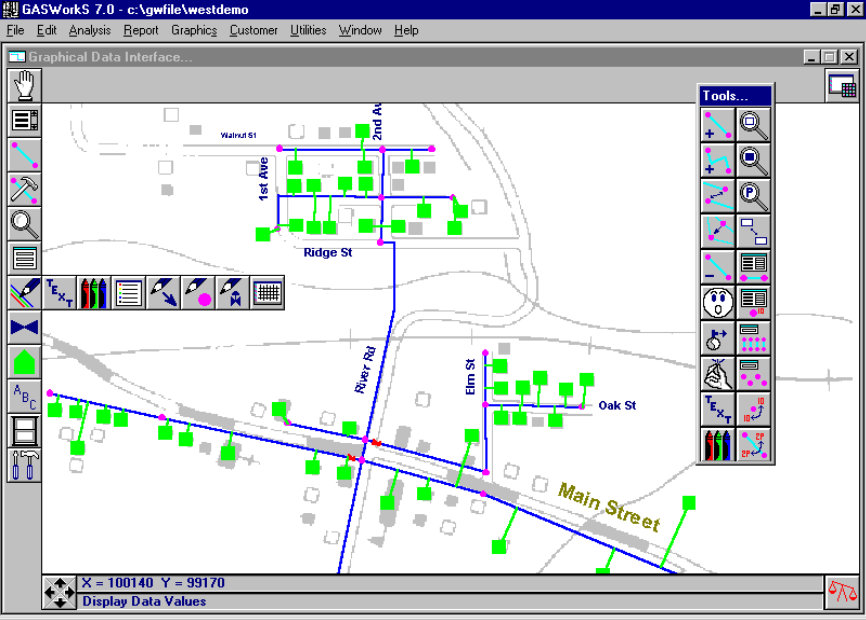
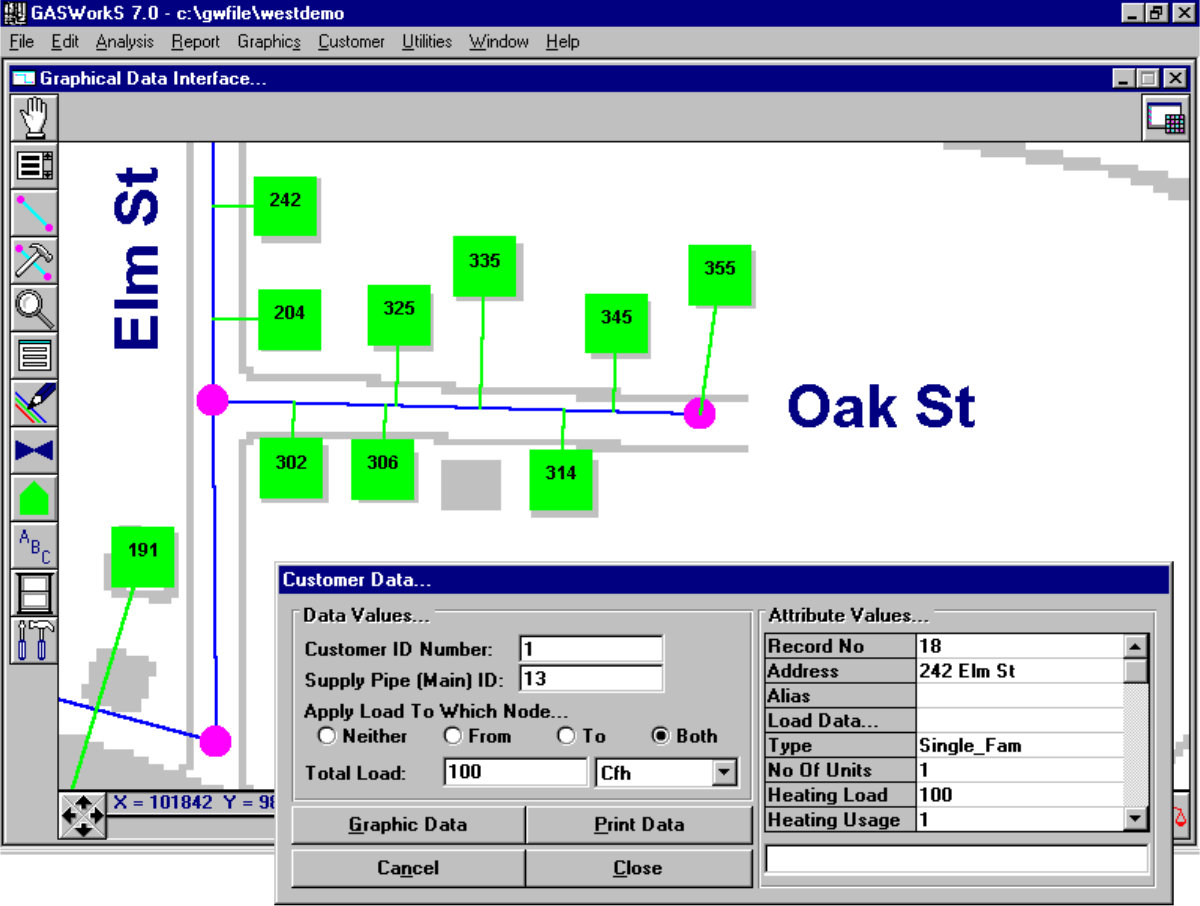
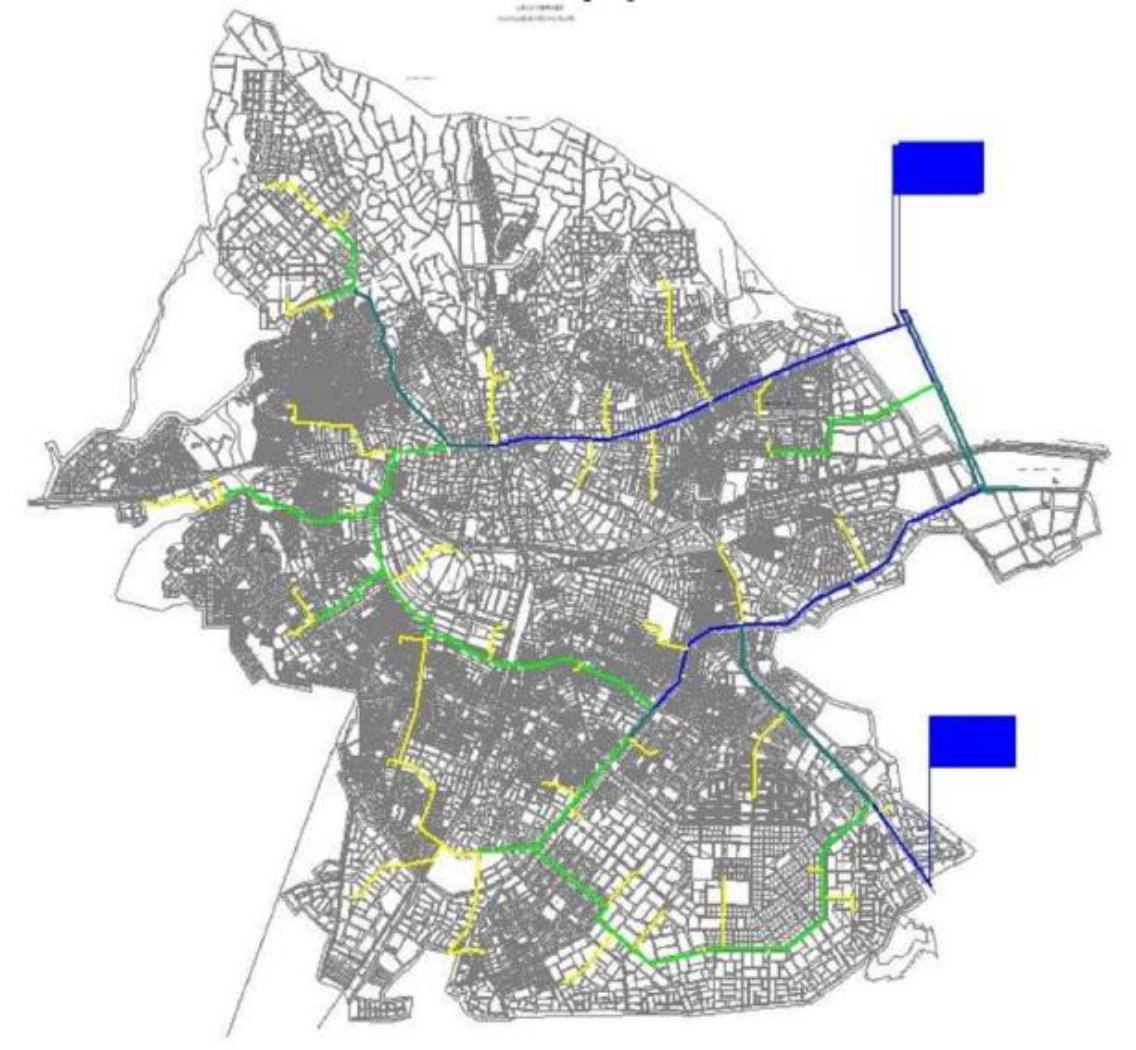
The Graphical Data Interface (GDI) provides map style graphical access to the model data. The GDI allows the inclusion of Bitmap (BMP) or Drawing Interchange File (DXF), or Shape (SHP file images as a reference background. Using the GDI, the User can draw the model schematic using point-and-click mouse entry, coordinate value entry, or relative distance and angle entry. The GDI provides pop-up data screens for editing and viewing of the various pipe, node and customer data and analysis results.
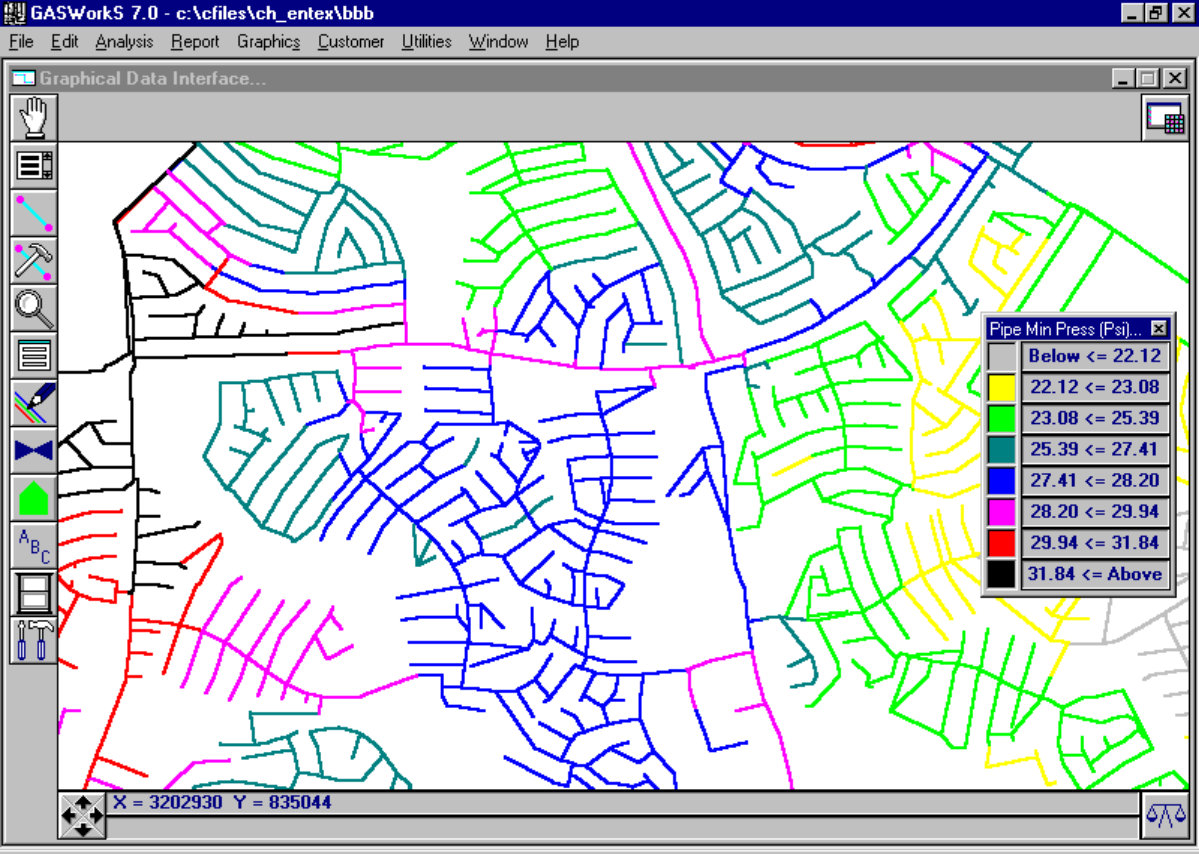
The GDI includes a wide variety of tools for modifying the pipe, node, and customer model features including routines for adding, deleting and moving features. Various zoom commands including the ability to zoom in by a User specified window, zoom by a User specified scale, and zoom to a previous view allow the User to easily move around the model image. A robust set of color coding and tracing routines enhance the User's ability to graphically review the analysis results and the system's performance. The trace routines are complimented by the inclusion of what we refer to as “valve nodes”. The valve node feature was developed to assist in the design and layout of emergency isolation areas. A complete set of annotation routines allows the User to include notes and references in the model graphics.
The GDI display can include:
- Two-point, polyline, and arc style pipe symbols
- Node, customer, and pseudo service line symbols
- Pipe, node, and customer data values as text
- Piping symbols for non-pipe type elements
- User defined annotation, graphic lines and shapes
- Fitting symbols
- Valve node symbols
- Flow direction arrows
- Marker flags
- And multiple background reference images.
The User may customize the GDI's display properties by setting display colors, line and symbol types, and display size and width.
The GDI tools are accessed through descriptive tool icons contained on function based "fly-out" tool bars, through a command line and list interface, and through a floating tool palette which can be arranged, sized, and placed to meet the User's preference.
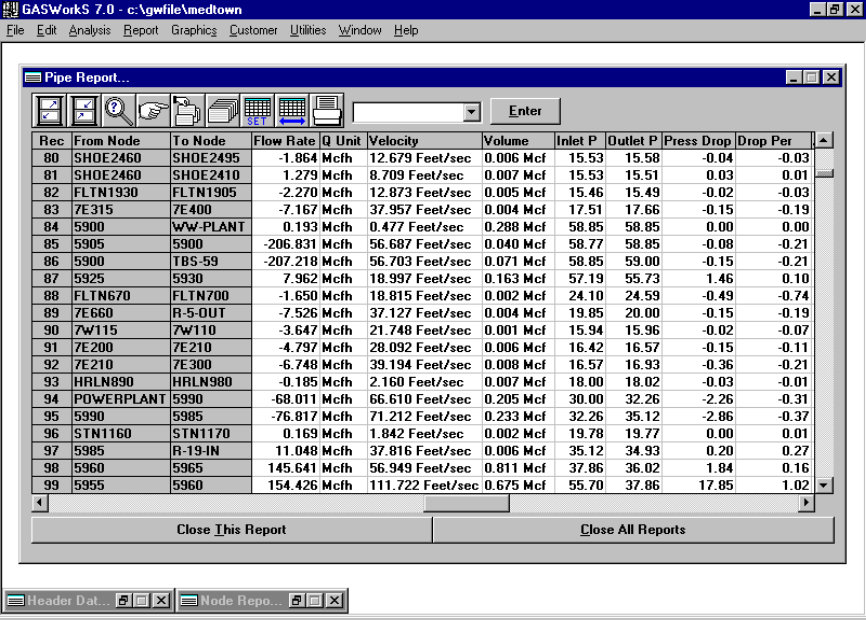
Report Routines
The report routines provide spreadsheet style reporting of the analysis results - including the ability to edit model data directly from within the report by simply selecting the cell you wish to edit and making the desired change. The User may select the items to be included in the report by collapsing the columns associated with the unwanted items.
The pipe report provides a comprehensive collection of information including reporting of both size/type and internal diameter values, reporting of pipe inlet, outlet and average pressures, flow rates, velocities and volumes, and simultaneous reporting of linear and pressure drop per User specified length. Selection sets may be created from within the standard reports, allowing unique reporting of User specified data groups. Hierarchical queries allow the creation of sub-sets from a previously created selection set. Reports may be printed onto any Windows supported device, allowing the selection of paper orientation, and font size and type.
Other Features
Import And Export Routines
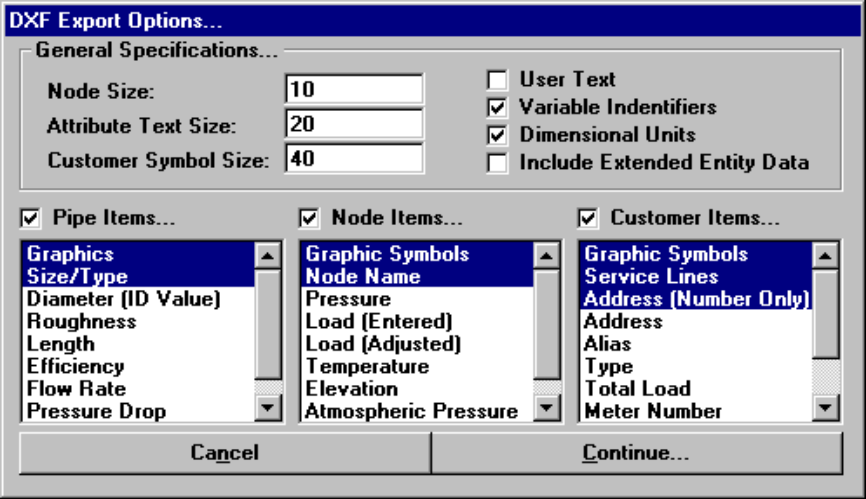
GASWorkS includes an extensive set of import and export routines allowing data to be exchanged between a variety of applications. Support is provided for ASCII and DBF, Microsoft Access and excel files, third party model data files, GIS shape (SHP) files, and a robust DXF translator allowing both import and export graphical data.
The DXF and SHP import rutines allow automatic creation of a GASWorkS model from a CAD drawing or GIS data set.
Customer Features
Diversified load values for antenna or skeleton type network configurations can be automatically distributed using the Diversity routine - based on the British IGE calculation standards. An external database may be attached to the GASWorkS customer data features. This is especially useful for connecting the billing file data to the model data.
Main Attribute Features
An external database may be attached to the GASWorkS pipe data features. This is useful for maintaining the non-model attribute data such as address, pipe specification, and test pressure values.
User Interface
Each of the GASWorkS routines are accessed through its friendly and efficient point-and-click User interface. GASWorkS is fully menu-driven and provides logical access to data and results. On-line help, including an extensive collection of how-to topics is just a click away.
What's New
GASWorkS™ 10.2 is the latest release of our popular network modeling software. First released in 1991, GASWorkS has continued to evolve to better meet our Users’ needs.Our latest release was developed for ease of use in an ever-changing industry and work environment.
Some of the new and improved features in the latest release include...
- Efficient license management - licenses are stored on our server, making it easier to support new and/or offsite User deployment while eliminating the need for Registration Number requests.
- Updates are automatically delivered right to your machine, helping keep all Users current and running the latest revision without the need for IT support.
- A more efficient Graphical Data Interface
- Support for zoom and pan with the mouse wheel
- Click to edit or view data
- Use of “grips” to move features and data text
- Improved data viewing and editing
- Improved screen layout
- Improved access to the GDI Command List and Tool Palette
- Support for “User” graphic images - display icons, pictures, or pdf documents in the model
- Enhanced data text handling - easily move text and automatically include leader lines
- Display User-defined tables in the model
- Display pre-defined User text in the model - include standard notes, etc
- Supports “associated” User text - link a User text feature to a node, pipe, or customer data value
- Add User text and include a leader line with a single command
- Supports import and export of KML format files - share data with Google Earth or compatible applications
- Performs coordinate projections to and from world coordinates based on standard “.prj” or “.wkt” files
- Includes support for “.jpg,” “.pdf,” “.tif,” and “.kml” format files as background images
- Support for 3D coordinates and Isometric display
- Convert a line entity in a vector-based background image to a pipe in the model - makes updating a snap
- Supports multi-line User text
- Support for node “attribute” data - especially useful for updating node loads
- Improved isolation valve handling
- Enhanced tracing - added additional options and color mixing for overlapping trace routes
- Improved multi-edit handling - easily update data or execute a command for a selection set
- Enhanced facility type handling - assign pipe flow equation or pressure units by facility type
- Enhanced default data handling - use specific default data, or use the data from the last data feature
- Quick Solve routine - single-click solution makes solving and viewing results more efficient
- “Favorite” results - allows quick review of results for User specified features
- Speed enhancements for nearly all commands and routines
- Improved data list handling for User-defined databases
- “Csv” export - create a selection set and create a spreadsheet-compatible file with a couple of clicks
- Quick Solve from a report - solve from the report screen and view updated results without reopening the report
- Enhanced System Summary report - more reporting options
- Date and time stamp for model data features so you can tell when an item was last changed
- Edit log to track changes to the model
- “Item” summary report to find and report item counts and quantities based on a User specified selection set
- Cut and paste property data (pipe, fitting, etc.) to/from the Windows clipboard
- Lock a Property Table to prevent unintentional data changes
- “A to Z” sorting of any item in a Property Table
- Cost and Part Number field included in all Property Tables
- Support for “power” type pipe flow equations - allows the use of CSST piping
- Support for “Fixed Pressure Drop” fittings and fittings with pressure loss based on a pressure drop equation
- Enhanced regulator handling - calculates droop, handles low inlet pressure and backflow switching
- Enhanced compressor handling - handles high inlet pressure and backflow switching
- Enhanced data text settings - separate settings for each feature type
- Model comparison routine - list the differences between two models
- Copy User Text, User Graphics, and Saved Views from another model - share these items between models
- Connect loose pipe ends - select a group of unconnected pipes and automatically connect them
- Import customer service lines from “dxf” and “shp” files
- Enhanced all import, merge, and export routines
- Copy and multi-edit User Text and User Graphics
- Copy a customer or pipe feature
- User Text, User Graphics, and pipe features can be associated as a group - think of it as a CAD block
- Added group handling commands - copy, move, delete, create, dissolve
- Added a “hydraulic status” to the node data - allows nodes to be turned ‘on’ or ‘off’ for tracing
- Added a “hydraulic type” to the node data - especially useful for tracing
- Use a “template” file when exporting “dxf” data
- Enhanced “snap” handling
- Supports display of a background grid and grid snap
- “Quick Size” routine - set up a sizing specification and run it with a single click
- Added a “Reduce Vertices” command - automatically remove unneeded vertices
- Added a “Snap Loose Pipe Ends” command - automatically connect pipe ends within a specified tolerance
- Added a “Straighten Polyline Pipe” command - removes vertices within a specified region
- Improved “unbroken intersection” handling - mark within a specified area, exclude nodes from review
- Improved symbol display handling - specify an on/off limit
- Support for multiple “undo” handling
- Redo handling
- Enhanced ShapeFile import handling
- Enhanced DXF export handling
- Improved overall User Interface
- Added routine to create a load summary table - especially useful for documenting mechanical style designs
- Enhanced Bill-Of-Material creation
- Added routine to automatically create a legend of User Graphic Symbols
- Symbolize fitting style hydraulic elements
- And much more.